Export your Profit And Loss report from QuickBooks directly into Google Sheets using G-Accon. Configure date ranges, comparison periods, currency settings, and automated refresh schedules — all without leaving your spreadsheet.
✅ Design a Report Template ✅ Schedule Automatic Refresh ✅ Modify an Existing Template ✅ Watch G-Accon YouTube Videos
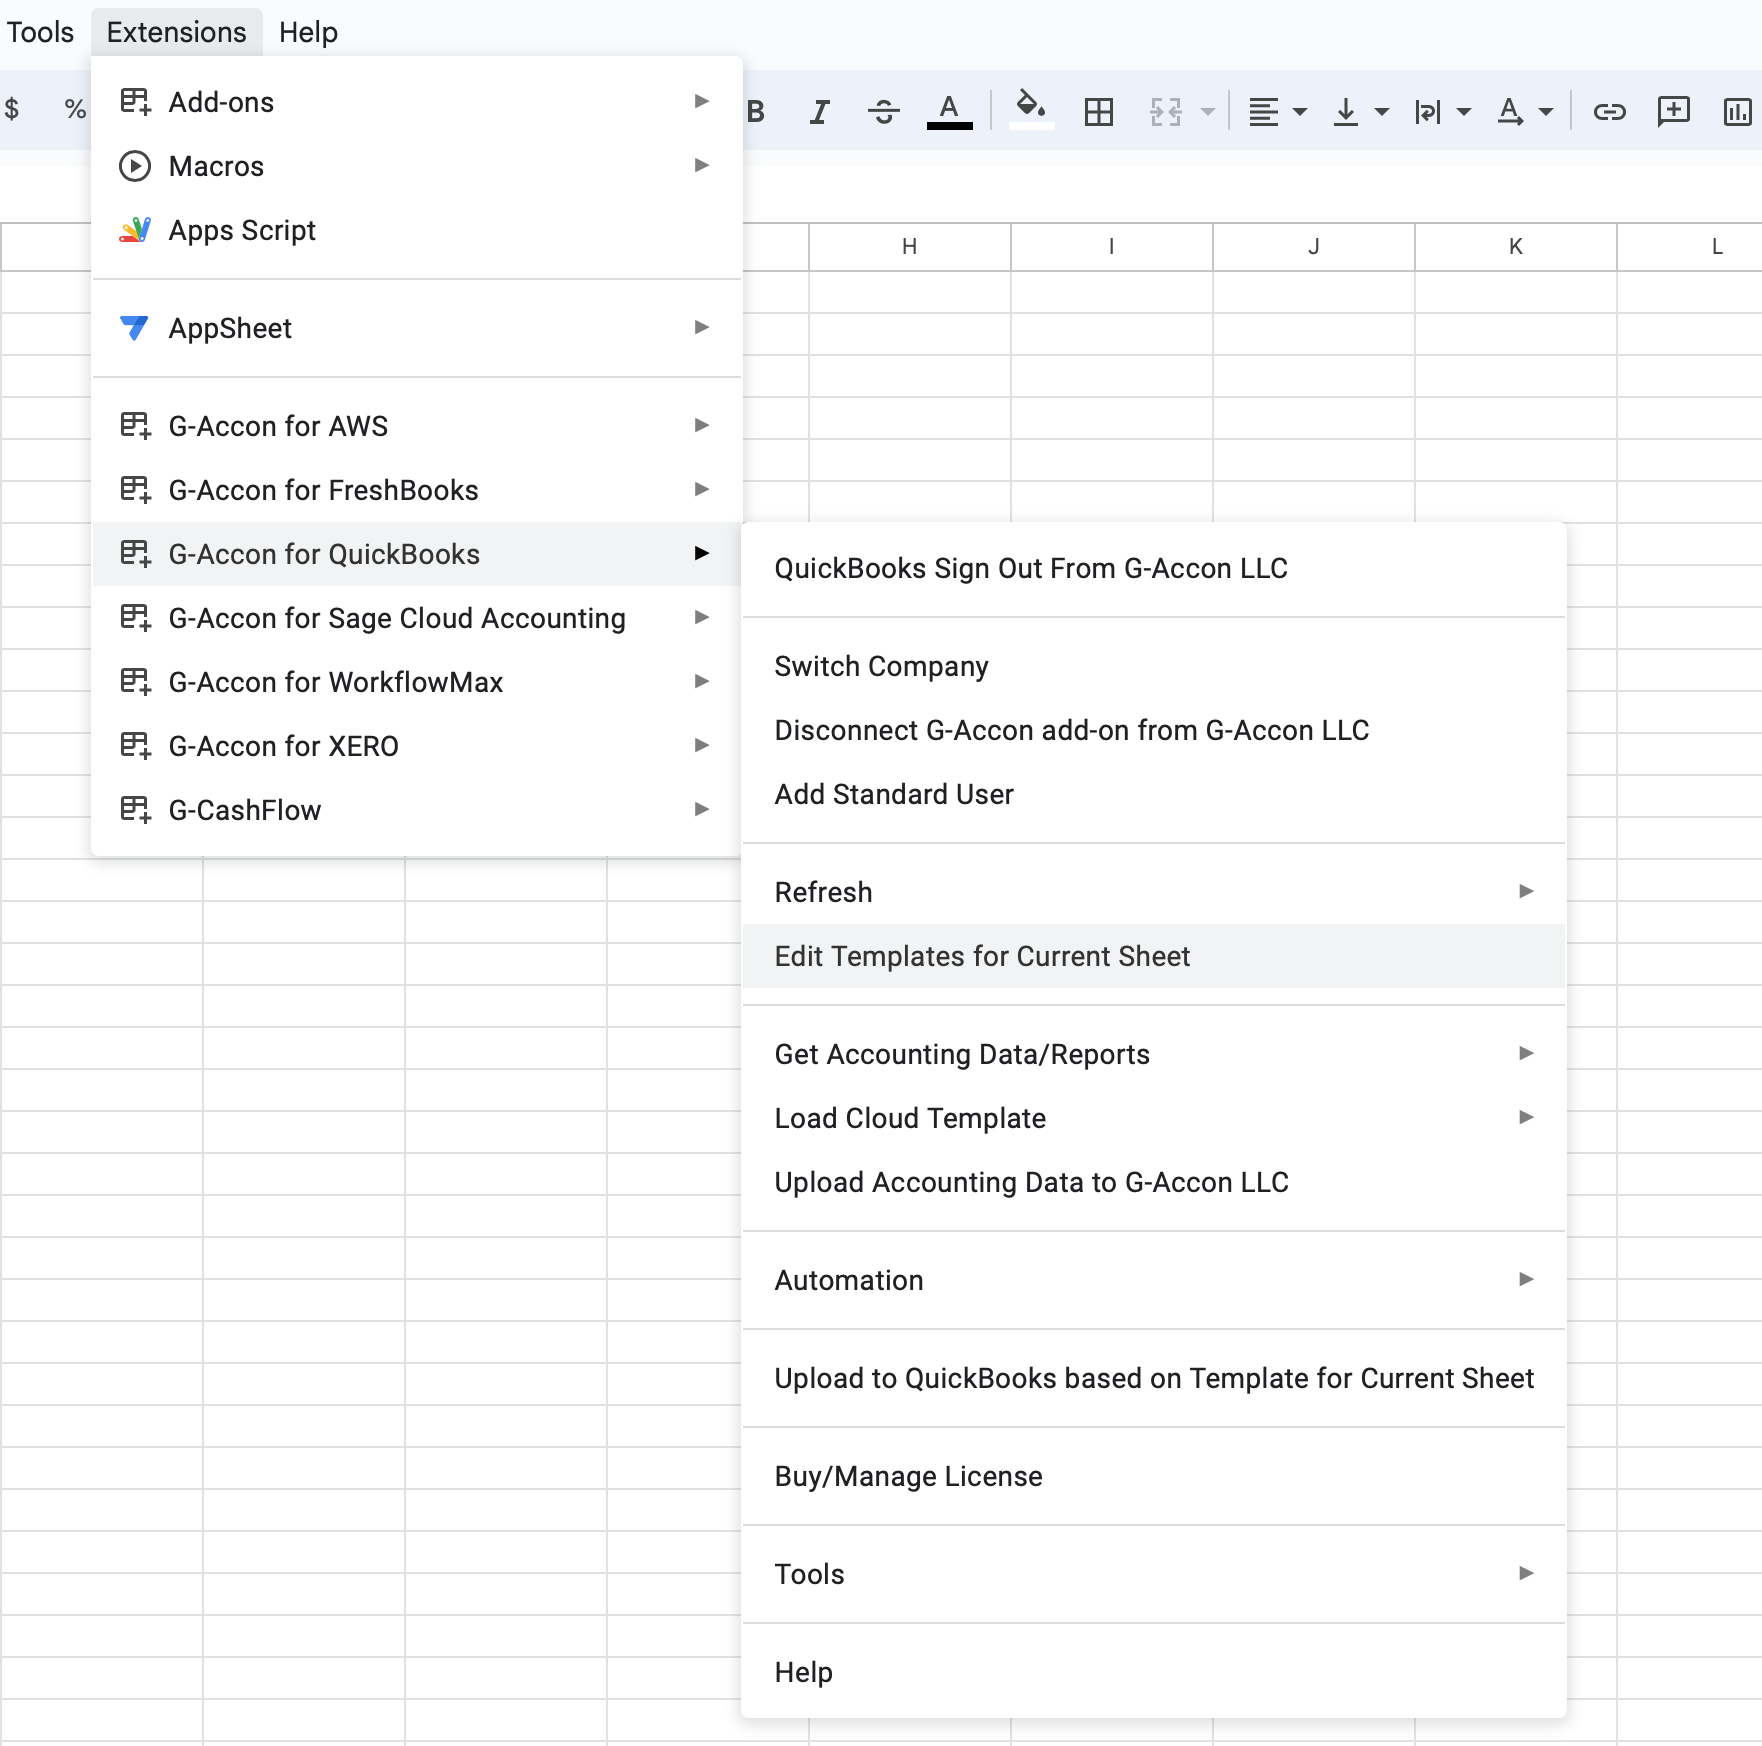
To pull your Profit & Loss data into Google Sheets, follow these steps:
Once you select Profit and Loss from the Custom Accounting Reports dropdown, the Get Report from QuickBooks - Create a Template window opens.
Here you configure all report parameters before executing.

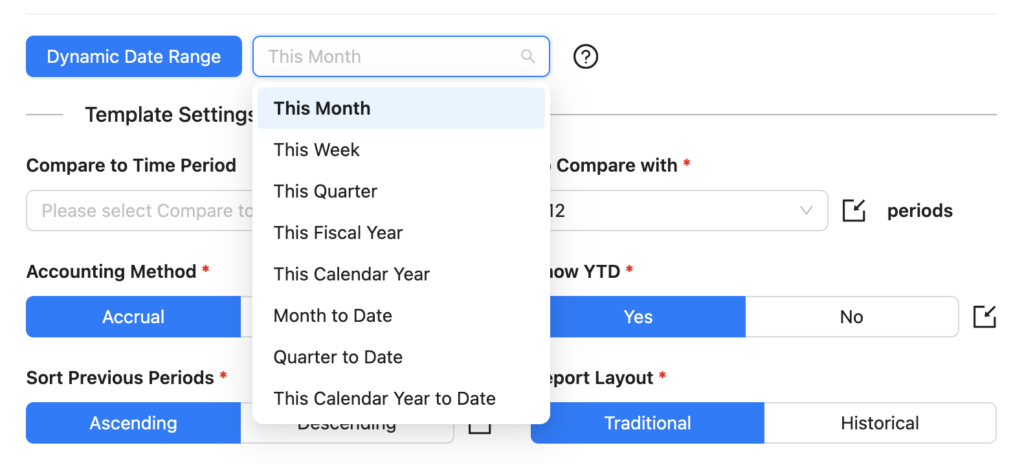
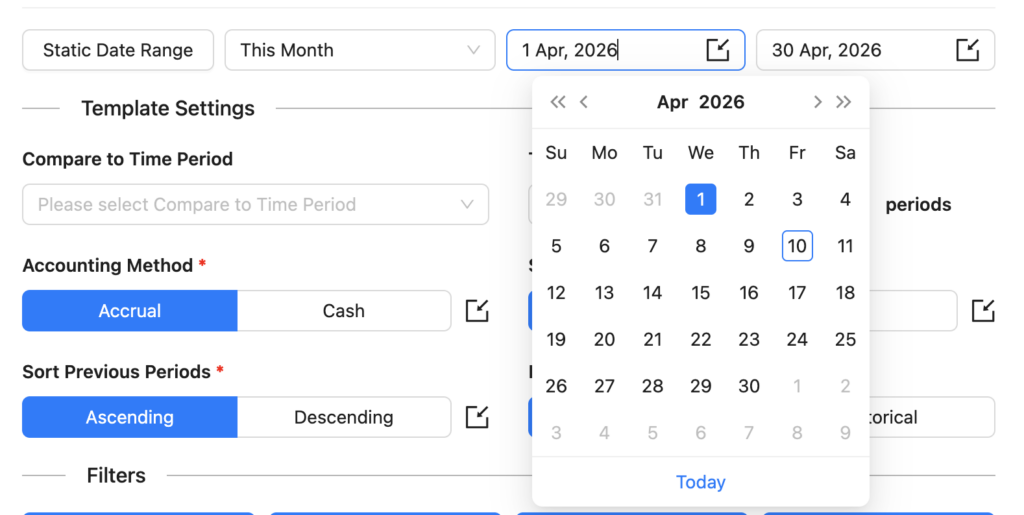
The Profit and Loss report supports three date range modes:
Report data is calculated based on pre-populated relative periods such as This Month, This Quarter, This Year, Last Month, and more. Ideal for recurring reports that always reflect the current period without manual date adjustments.
Define a fixed start and end date for the report. The date range remains unchanged each time the report is refreshed, making it suitable for historical snapshots or period-end reporting.
Reference cells in your Google Sheet to drive the report dates dynamically. This is useful when date inputs are controlled by a dashboard or input sheet, allowing multiple reports to be updated by changing a single cell value.

The following parameters must be configured before executing the report:
Compare to Time Period — select the number of previous periods to include as comparison columns alongside the current period.
Show YTD — set to True to display a year-to-date cumulative column alongside period columns, or False to show period data only.
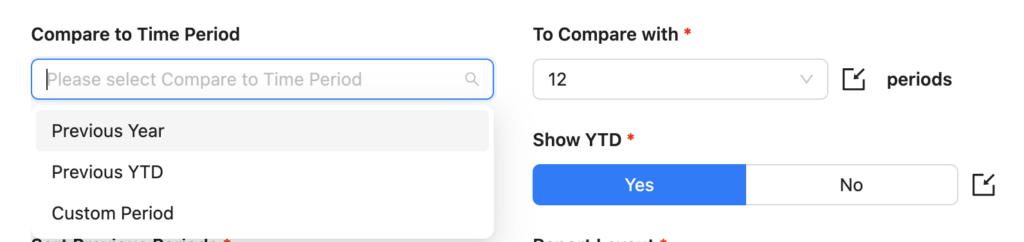
Accounting Method — choose either Accrual or Cash basis reporting.

Sort Previous Periods — control whether comparison periods are displayed in Ascending or Descending order.


Report Layout — choose between Traditional or Historical layout (see below).

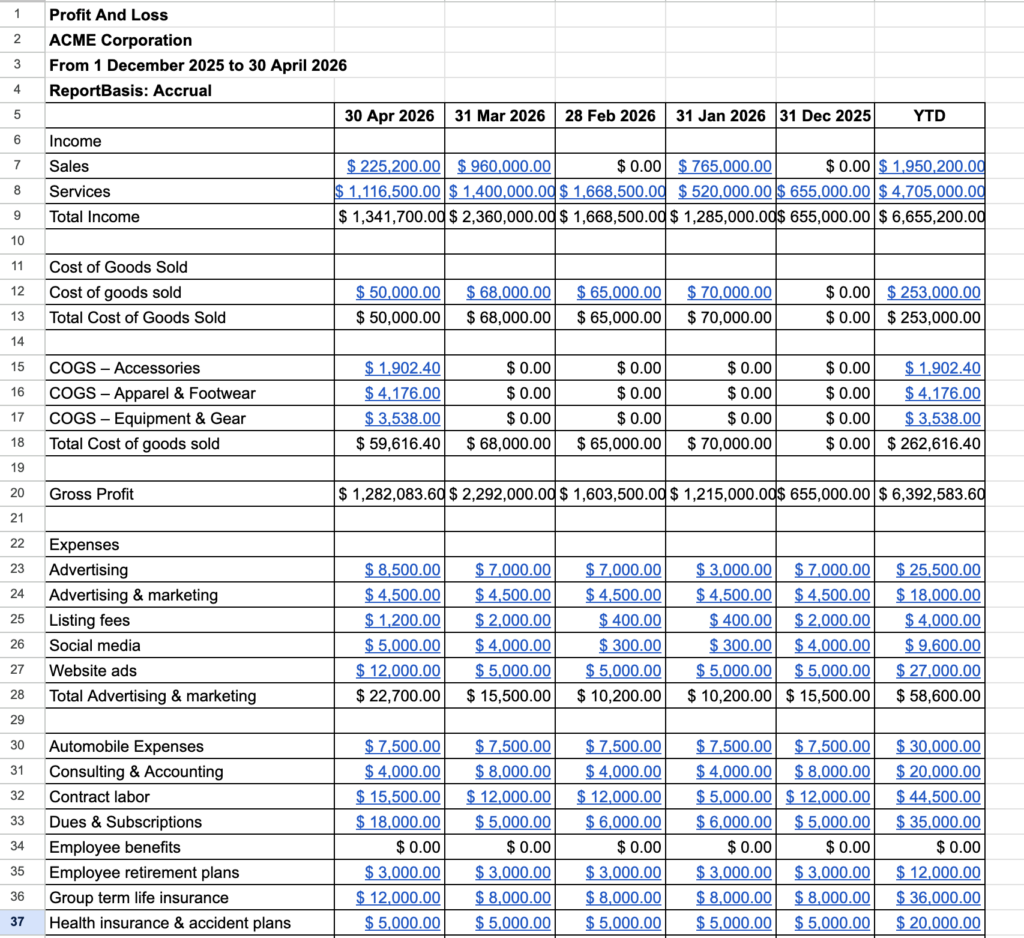
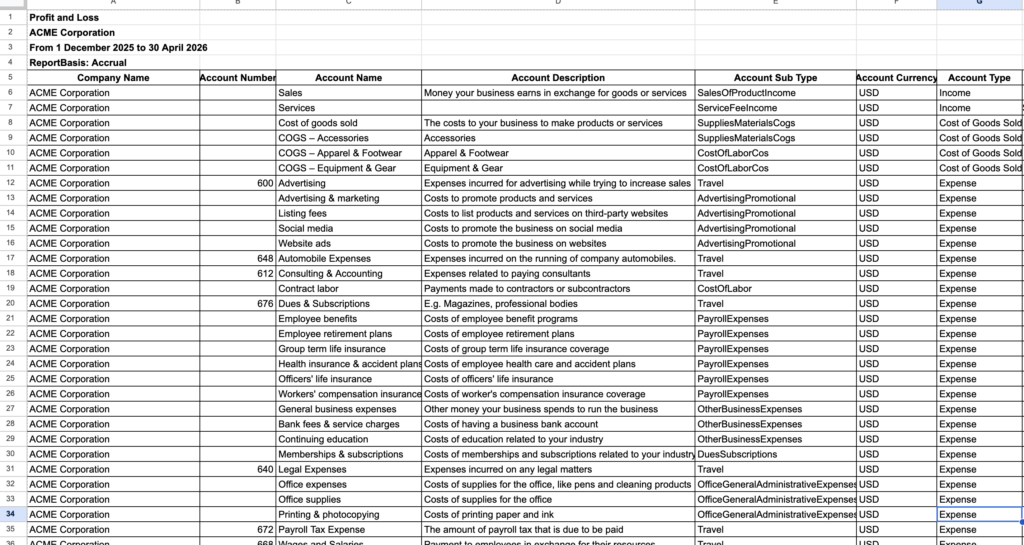
The Traditional layout presents your Profit And Loss report in a standard financial statement format — revenue at the top, followed by cost of goods sold, gross profit, operating expenses, and net income. This is the most widely recognized P&L structure and is well-suited for management accounts, client reporting, and statutory-style summaries.

The Historical layout is designed for trend analysis and multi-period comparisons, making it the preferred format for Business Intelligence (BI) solutions and FP&A workflows.
Data is structured with detailed line items across multiple columns, each representing a different period, so you can track performance over time, identify patterns, and feed data directly into dashboards or financial models.
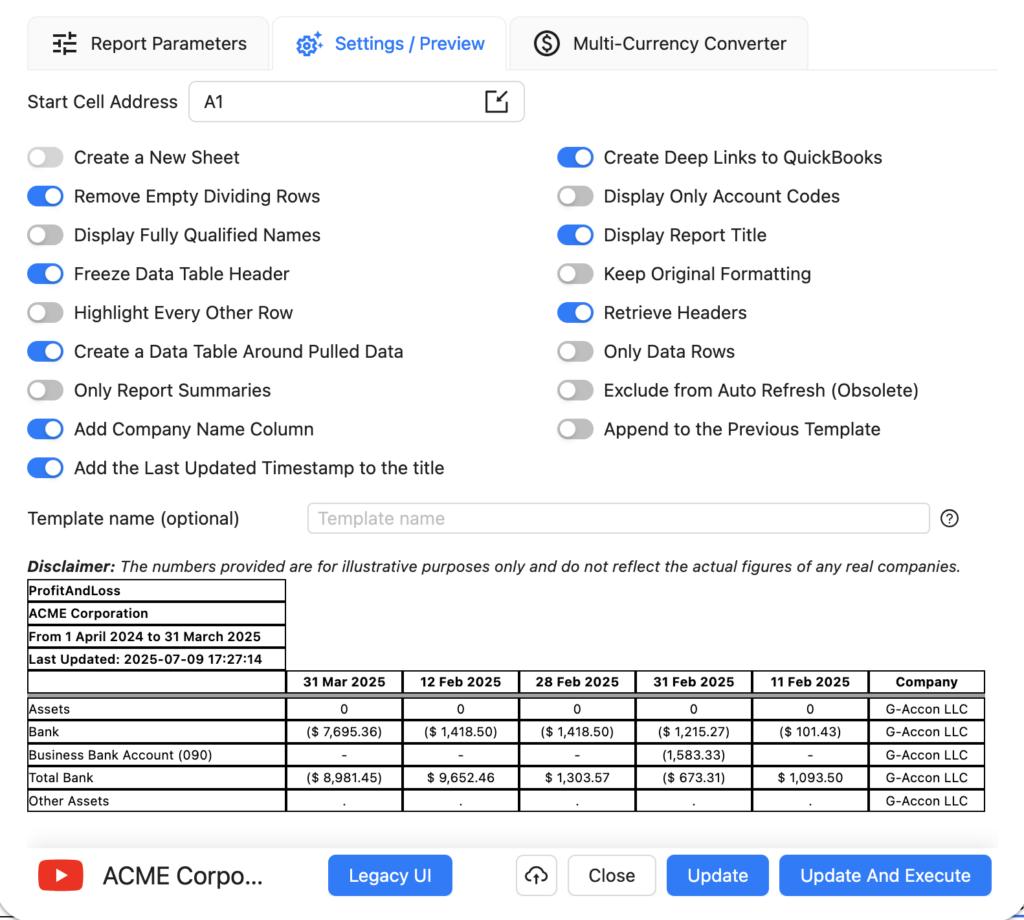
The Settings/Preview tab gives you fine-grained control over how report data is presented in your Google Sheet. All settings are optional and can be combined to suit your reporting workflow:
You can also specify a Start Cell (e.g. A1) to control exactly where in the sheet the report is placed, and assign a Template Name (e.g. Template Name #1) to identify the report when managing multiple templates in the same spreadsheet.
If you need to generate your Profit & Loss report in a currency other than your QuickBooks base currency, the Multi-Currency Converter tab lets you select a target currency and choose how exchange rates are applied.
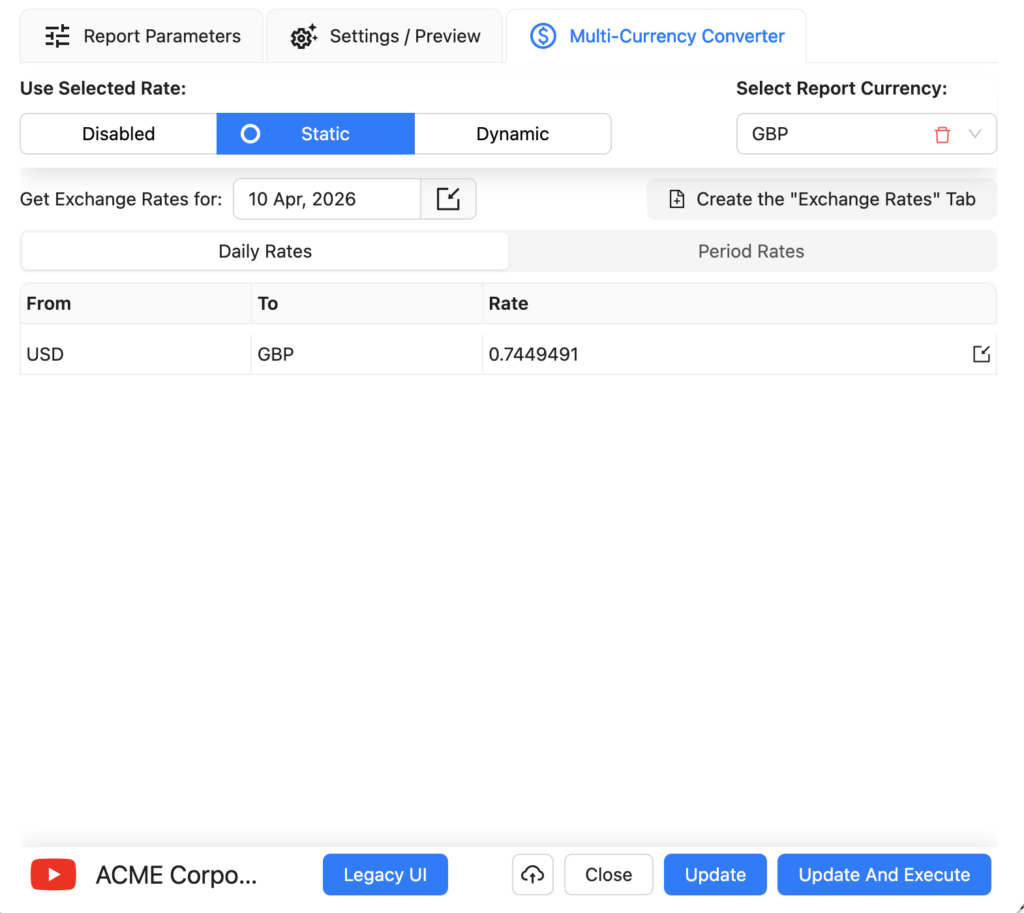
Three options are available:
Select your target currency (e.g. EUR) and choose Use Latest Rates. Each time the report is refreshed, G-Accon will automatically fetch the most current exchange rate from its provider and apply it to all values in the report. No manual rate input is required.
Choose Use Custom Rates to manually specify an exchange rate for a particular date. You can either enter the rate directly in the converter panel, or create a dedicated tab in your Google Sheet containing custom rates — useful when you need to lock in a specific rate for audit or compliance purposes.
For reports spanning multiple periods, Use Custom Rates for Periods lets you assign a different exchange rate to each period in the report. This is essential for accurate multi-period comparisons where exchange rates fluctuated significantly — for example, in monthly or quarterly P&L reports covering a full financial year. Rates can be entered in the converter panel or managed in a dedicated Google Sheet tab.
Once your currency settings are configured, click Execute to generate the report. The converted figures will appear directly in your Google Sheet in the selected currency.
G-Accon's Automation feature lets you schedule your Profit & Loss report to refresh automatically — no manual intervention needed. You can also configure notifications to alert team members, clients, or stakeholders when a refresh completes.
To set up an automated refresh:
For full details on workflow configuration, refer to the Create Workflow documentation.
If you need to change the parameters of an existing report — for example to adjust the date range, add a comparison period, or change filters — you can edit the template directly without needing to rebuild it from scratch. You also do not need to be signed in to your QuickBooks organisation to modify or refresh a template.